My particle counters touch screen is not responding properly.
Many of our particle counters viable samplers and even the ScanAir pro have a built in screen calibration. Performing the screen calibration is simple.
This is how you perform a screen calibration on many of our instruments. If this method does not work please contact our technical support team to run you through more trouble shooting steps.
All sound measurements were taken 130mm from the front of instrument.
To find out the sound levels of our other particle counters feel free to contact us
For reference the CDC states a normal conversation or an air conditioner is around 60db.
Using a Serial Connection
Not being able to download data from your particle counter over a serial connection usually has one of two root causes.
1. The Cable is broken or damaged
To trouble shoot this inspect both ends of the cable for any sign of bent pins abnormal wear or cuts If the cable looks good continue to step two
2. Download the correct drivers for serial
If you have a computer you have never downloaded data with you may need to download appropriate the drivers which can be found HERE .
If you still cannot connect to your instrument feel free to contact tech support by either submitting a tech support form or using the live chat function on the bottom right of your browser.
The ApexZ portable particle counter has the industries longest battery life. As we all know over time batteries begin to lose their efficiency,
The ApexZ batteries have a sleep mode feature to reduce self discharge if the lithium-ion battery fully reaches 0% the cell could be permanently damaged. This feature prolongs the batteries life.
If the battery is removed from the instrument and stored the battery will enter sleep mode. Which provides a minimum of 6 months shelf life, when stored at 20℃.
To bring the battery pack out of sleep mode simply insert it into the ApexZ and apply power or put the battery pack on the charger.
Packs should never be allowed to discharge to zero capacity in storage.
If you have any further question send us a live chat message on the bottom right of your screen.
Standard Size Calibration (includes as received data)
ISO 21501-4 Calibration (includes as received data)
(Recommended) ISO 17025 Accredited Calibration (includes as received data) Click here to find out more What to expect from an ISO 17025 calibration
You can request a calibration on the RMA Website.
LMS Pharma
A stale triggers after a record hasn’t been recorded for three times the sum of SampleTime/HoldTime/InitialDelay settings
Follow these trouible shooting steps to get your unit on line and your cleanroom back in order:
1. Remove power from the unit
2. Remove network or serial connection
3. Re insert network or serial connection
4. Apply power
5. Wait for the first clear data reccord.
Note: For POE units step 1 and 2 are combined and step 3 and four are combined
If the error persist contact tech support HERE or talk to a product specialist using our live chat feature in the bottom right of your browser.
You can simply click HERE to visit out technical support page .
You can also use our Live Chat function on the bottom right to talk to one of our product experts.
People often think of contamination as particles, dust, dirt or some type of chemical residue. Lighthouse looks at contamination per the Institute of Environmental Sciences and Technology (IEST) definition: “Any foreign material or energy that has a detrimental effect on product or process.”
Examples could be:
Why do I need to monitor the state of my cleanroom?
There are two main reasons why you would monitor your cleanroom. One is to verify that your process environment is performing at the required specifications. The other is to document historical data of the process environment. Cleanrooms are built to the specific requirements of the products to be built. Contamination has a negative effect on yield and quality of these products. The cleanroom environment is very dynamic with products and personnel moving and changing, thus contamination events can happen at any time. Monitoring will enable you to know when the environment is not safe for building the products at any time. The ability to recall historical data is a very valuable tool to have. Trend charts, and records of events can help define maintenance cycles of equipment and cleaning. In addition, post mortem analysis is simplified when referring to this data. These reports will serve as records that can be used to present supporting data to customers, government organizations, and regulatory committees.
Can’t I just hire some people to go around to each room once a day and measure the cleanliness of each area?
Historically most companies started out that way, but companies learned that determining the level of particles in a room is not as simple as taking one single reading. Particulate levels must be measured at multiple locations throughout the cleanroom wherever product is exposed. Cases where measurements have been taken near HEPA or ULPA filters may show low particle levels, and yet at the product level work surface particulate levels may be unacceptable, causing product defects and lowering yield. Cleanroom processes are dynamic. Particle shedding events are rarely predictable, and can happen at random times throughout the day. Monitoring this environment on a continuous automated basis will help to catch these types of issues before they get out of control or affect production. Millions of dollars worth of products can pass through a cleanroom on a daily basis depending on the type of facility. Finding out about a contamination problem a day or two late could be an expensive and/or catastrophic situation. In most cases, the Return of Investment (ROI) on the contamination monitoring equipment and the system can be achieved during the first few detected events.
How can I effectively monitor my cleanrooms?
First you have to identify what the risks are for your product and process. Also, you need to understand the design intention of the cleanroom. This is necessary, as you would want to choose the right instrument for the application. A class 10,000 (ISO Class 7) cleanroom would not be monitored effectively with a 0.1 micron. Using a 0.3 or 0.5 particle counter would be a better choice.
What size particles do I need to monitor for?
This is determined by your product or your process. Other factors such as coverage and budget come into play. The smallest size particle that could possibly affect your product or smaller is a good place to start. However budgets and coverage of the whole process must be taken into consideration as well. Keep an important factor in mind. Particle shedding events occur at more than one particle size. Having one particle sensor in a cleanroom with 0.1 micron or lower resolution vs. having ten particle sensors with 0.3 micron resolution in the same cleanroom may not be a better situation. You must look at what is going on and what the risks are. Sometimes, many less sensitive sensors are better than a few or one of the more sensitive sensors.
How do I determine the number of airborne particle sample points that I need to monitor in my cleanroom, and where should I locate them?
The location and number of monitoring points is primarily dictated by the requirements of the product and the production process as well as understanding how the system will be used. Please refer to the Tech Papers section on this website to download “Justifying a Continuous Contamination Monitoring System”.
How do I justify the expense of an Automated Monitoring System?
Please see our Tech Papers section on this website for “Justifying a Continuous Contamination Monitoring System.”
Why can’t I use my building automation or facility control system for monitoring my cleanroom?
Many customers of ours have asked this question, and from a technical standpoint, it is possible to do so. There are several reasons for not integrating solely to the building control system. The primary responsibility of a control system is to keep the facility running between a given set of parameters. Data inside the control limits is often not recorded. The facility group’s primary responsibility is to keep the facility running within the set-points, by maintaining and repairing utilities. Contamination monitoring is more of a primary function of a quality, engineering or contamination control group. Sensing points are placed with a different intent for the data.
Often we will integrate our LMS system to a building control system (BCS), in fact we encourage our customers to do so. Integrating this data (either uni-directional or bi-directional) to and from a BCS will increase the number of monitoring points on both systems giving the customer a better perspective of what is going on in the controlled environment.
What is the difference between a control system and monitoring system?
The main differences between these systems are the architecture and principles for which they serve. The building control system is designed and installed with the critical parameters of the facility in mind. The sensors for that system are installed and provide feedback allowing for automatic compensation for out-of-spec events. A monitoring system is geared toward monitoring the process and product level of information. The two systems may share some overlap in the general environment, but both are very necessary for tuning your process. Without the process level of monitoring, you will not be able to detect changes in process environment due to factors contributing from personnel, or equipment.
When or where should I use a discrete based particle counter system vs. a manifold type?
Both systems have their place and usefulness. A discrete based or remote particle counter system gives great resolution without missing any data. The cost per point is more expensive than a manifold system, but has a better chance to catch intermittent particle excursions. A manifold sampling system is much more cost efficient, but sacrifices resolution due to the time it takes to rotate one complete revolution on the manifold. The more manifold points you add to the manifold, the longer it takes to complete one cycle, and it is possible to miss events while sampling other locations.
When evaluating your process to determine whether a discrete sensor or manifold system should be used consider the following things:
In short, if the maximum time of one complete sampling cycle on your manifold exceeds your maximum duration you can have without data from a single point you should try to use a discrete sensor for that location. In many cases, Lighthouse will recommend a hybrid of systems, or both a manifold and discrete system working together. The manifold system for non-critical, or lesser critical locations, and discrete sensors for more critical parts of the process. This will allow excellent coverage and data, and still be cost effective. Please see our Tech Papers section on this website “Continuous Particle Monitoring: An Evaluation of Real-time Versus Sequential Sampling Particle Monitoring Systems.”
The fundamentals of particle counters are relatively simple. You need to know how and why they work. If you have a basic grasp of these fundamentals, you’ll be on your way to better understanding particle counters.
An aerosol particle counter works on the principal of either light scattering or light blocking. An aerosol stream is drawn through a chamber with a light source (either Laser Based Light or White Light). When a particle is illuminated by this light beam, it is redirected or absorbed. Light scattered by a single particle in a specific direction in relation to the original direction has a unique signature which relates to the size of the particle. This allows for sizing and counting of individual particles.
A particle counter is made up of 4 components:
Often the selection of a particle counter for use in a cleanroom is done based upon the specifications and cost of the instrument.
Before getting into the details of the specifications it is important to look at what the instrument will be used for, the environments it will be used in, and who will be using the instrument. Without this information taken into consideration, a less then optimal choice of particle counter for the application could be made. Here are some items to consider prior to selecting a particle counter:
What type of environment will the particle counter be used in? Will it be used in an ISO Class 3 Cleanroom for routine particle counting or will it be used for verifying a flow bench is operating prior to a critical process?
What type of data is the particle counter expected to collect? Will this information be recorded as simple pass/fail or will the information have to be logged into a spreadsheet or database?
Will the operator be carrying the particle counter around and placing it on a critical work surface or will it be cart mounted?
Will this particle counter be used to certify cleanrooms and travel from location to location?
Will the particle counter be used to monitor the cleanroom on a continuous basis? Is the particle counter intended to interface with a Facility Monitoring System (FMS)?
Specifications:
Though all manufacturers use the same principle, the details of the design are what set one manufacturer apart from the rest. Things like sample flow rate, sensitivity, size range and number of counting channels, durability of the laser or laser diode, lifetime of the light source, the ability to hold calibration all are important factors to consider.
Sensitivity: The smallest size particle that can be detected.
Zero Count Level or False Count Rate: The number of falsely reported particles using filtered air at the optimum flow rate for a given amount of time. The correct reporting of this is number of particles per 5 minutes. (Expected Zero Count rate should be less then 1 count per 5 minutes)
Counting Efficiency: The ratio of the measured particle concentration to the true particle concentration. The true particle concentration is measured with a more sensitive instrument that has a counting efficiency of 100% at the minimum particle size of the instrument under test. A properly designed instrument should have a 50% counting efficiency.
Channels: This is the number of “bins” the particles are placed in based upon the respective size of each particle counted. Channels are represented in microns. For example, you may have a particle counter with 4 channels. This means that the particles can be counted and binned in 4 different channels. Examples of channels are: 0.1 µm , 0.2 µm , 0.3 µm, 0.5 µm , 1.0 µm , 5.0 µm .
Flow Rate: This is the amount of air that passes through the particle counter. This is typically represented in cubic feet per minute. Common flow rates are 1.0 cfm and 0.1cfm. The greater the flow rate, the larger the pump to pull the air and the bigger the particle counter.
All too often minimum size is chosen over the other criteria. Though this is an important consideration, other parameters should also be considered.
Typically the more sensitive instrument, the higher the initial investment, and the higher the maintenance cost. If the instrument is used in environments with extremely high concentration of particles, it may require frequent cleanings by service technicians.
By understanding the intended use of the particle counter and the specifications, a more educated decision can be made when selecting a particle counter.
Lighthouse Customers
We regard our customers as business partners. Working in close partnership with our customers, we have arrived at systems and solutions that have revolutionized the approach, concepts, and results of the monitoring industry. Together, we have reengineered the industry, driving our suppliers and competitors to continually improve.
Lighthouse has grown to be an integral part of our customers’ manufacturing process. We are on a quest to improve yields by providing state-of-the-art technology. We have learned that Lighthouse and our customers all benefit from one another.
Lighthouse Worldwide Solutions truly is worldwide. We have performed hundreds of installations around the globe, servicing industries ranging from semiconductors and disk drive manufacture to aerospace and pharmaceuticals. Lighthouse customers include: Western Digital, Seagate, Applied Materials, Fujitsu, Hewlett-Packard, Hitachi, Hyundai, IBM, Komag, Lockheed Martin, Los Alamos National Laboratories, LSI, MEMC, Motorola, National/Panasonic, Quantum, Raytheon, Samsung, Sharp, Texas Instruments, TSMC, USC, VLSI, Xerox and many, many more…
Lighthouse Direct Offices
Lighthouse is committed to providing local offices in each of the regions where our customers do business. Direct sales, service, installation, and project management allow our customers to have a direct connection with the Lighthouse Team. We now have offices in California, Singapore, Taiwan, Philippines, Thailand, two in Malaysia, two in China, and most recently, we have added an office in Holland. Our strategy of establishing close regional contacts has proven very successful for Lighthouse and our customers over the years. Maintaining and expanding those contacts will remain a crucial part of our corporate strategy for success.
Lighthouse Installations
The Lighthouse Installation Team provides quality installations and system expansions. Our skilled professionals include project managers and installation crews worldwide, who make the installation of a Lighthouse system as seamless as possible. We provide the best quality installations in the industry. Our quality work, attention to detail, efficiency, and creativity to adapt to your needs are proven.
All Lighthouse installations undergo a rigorous data validation, quality, and system integrity check.
Lighthouse Service Team
The Lighthouse Service Team provides the best resources and expertise available. We are constantly receiving letters of praise from our customers thanking us for meeting and exceeding their needs.
Preventive Maintenance
Lighthouse has tailored a preventive maintenance program to maintain and extend the life of our system. This program includes the following:
Improvement Meetings
The “Improvement Meetings” are scheduled meetings where our customers can ask questions and express their views on the use of the Lighthouse system. The Lighthouse Service Team takes a proactive approach toward improving the use of the Lighthouse system. Below are some examples of topics that are discussed.
1. Enhancement requests
2. Outstanding items to be completed
3. Brainstorming about new ways to monitor
4. User training needed
5. Future system planning and requirements
6. Latest technical updates
7. Latest sensor updates
8. Latest monitoring methods
9. Industry trends in monitoring
10. New features to be released in Lighthouse’s next version
Calibration
Lighthouse has Full Calibration Service centers at all direct offices around the world. Calibrations are completed within 7 working days from receipt of the unit.
The following procedures are performed during calibration:
1. Removal of the sensor
2. Installation of the customers spare sensor or a Lighthouse spare (if available)
3. 9 point inspection program
3.1. Record equipment ID numbers
3.2. Laser current
3.3. Laser voltage
3.4. Air flow
3.5. Pump operation
3.6. Functionality
3.7. Printer operation
3.8. Communication ports
3.9. Cosmetic
4. Calibration of the sensor
5. Reinstallation of the calibrated sensor
6. Validation of sensor data
7. Verification of data collection at the Lighthouse system
8. Provide a Calibration Certificate for each sensor
Sensor Repair Center
Lighthouse Sensor Repair Centers are located in California and Singapore. Our repair centers are capable of the following:
1. Sensor calibration
2. Internal sensor cleaning
3. Sensor board replacement
4. Laser replacement
5. Filter replacement
6. Internal tubing replacement
7. Critical orifice replacement
8. Internal component replacement
9. Vacuum pump replacement
10. Sensor head replacement
Application Technology
Lighthouse has an Application Technology Department that provides pre- and post-sales support.
Pre-sales support includes the following:
Post-sales support includes the following:
Additional services include the following:
Customer Training
Lighthouse is dedicated to continually train our customers. We hold multiple training sessions at our headquarters in San Jose, California each year. We also offer training in our regional branch offices and at our customer’s sites. Our training courses include the following:
Lighthouse Listens
As our customers drive to improve manufacturing processes and stay competitive, their monitoring needs to constantly change. Lighthouse listens to our customers. We work as partners to adapt and improve our products and services as needs change. Features, drivers, enhancements, and fixes are all a part of our improvement process.
Software Development
The Lighthouse Engineering Team was founded in 1982. The abilities and vast resources that “Our Team” has are unbeatable. We are committed to total excellence, whether it is in databases, documentation, custom drivers, testing, enhancements, or adding a new feature.
Growing Your System
One of the most common statements from our customers is “Wow, I didn’t know the system could do that.” The Lighthouse system can monitor many things both inside and outside the facility. The most commonly found sensors include:
Lighthouse is the Proven Leader
Lighthouse has the largest systems installed worldwide. There are many things to consider when purchasing, testing, and/or expanding a system. Some of these include the following:
ISO and CE
Lighthouse is ISO Certified. Lighthouse believes in quality and in exceeding industry standards. Lighthouse products are CE approved.
Engineering the Future
The future is guaranteed to be both dynamic and unpredictable. Together with our customers, Lighthouse will work hard to find new ways to drive the industry. We will continually strive to be the shining light in the darkness, pointing the way for many years to come.
A Building Management System (BMS) also known as a building automation system (BAS) is a computer-based control system installed in buildings that controls and monitors the building’s mechanical and electrical equipment such as ventilation, lighting, power systems, fire systems, and security systems.
The Lighthouse Monitoring System (LMS) provides a single point of configuration and data analysis. It offers the capability to view graphs, charts, maps, SPC, system status, sensor status, and more. Each of these can be customized and displayed simultaneously. The LMS provides superior data collection reliability by providing redundant data collection engines, redundant data storage and data viewing. The LMS system can monitor Particle, Temperature/Relative Humidity, Differential Pressure, CO2, and many other environmental sensors related to your cleanroom environment.
An Administrator to the software must log in and re-enable your account.
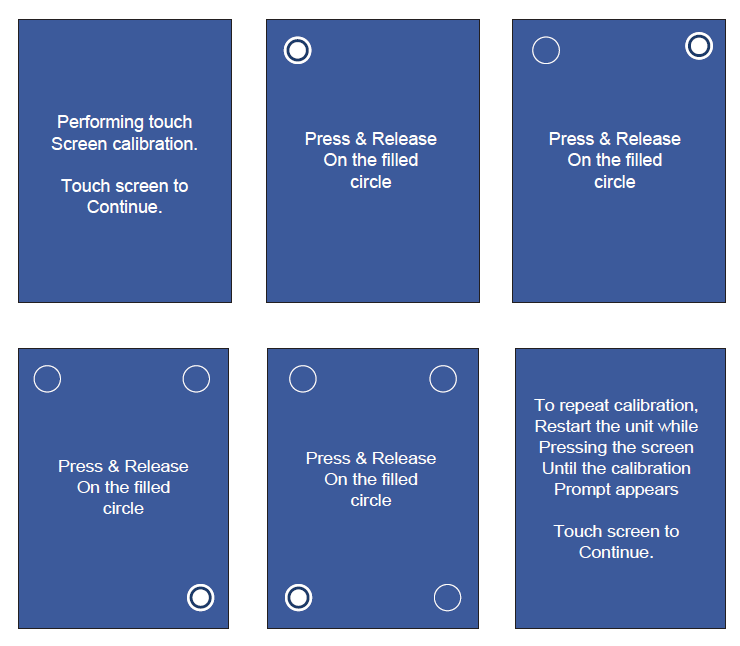
(Applies to all Lighthouse Portable Particle Counters)
Not being able to access the data on your particle counter could be frustrating. We get this question a lot.
How do I download data from my particle counter? and more specifically the handheld 3016 due to its flexibility and mobility taking smaller samples you want to analysis right away often happens.
Well here are the steps to make sure you can download the data. More in-depth steps can be found in the operating manual but since you’re here
If you’re still having trouble find us on live chat on the bottom right of your screen or submit a tech support request here .
Yes, use LMS XChange or LMS Express (Free Version) and go to “setup my location” to name locations then upload location names to your Hand Held.
No, the SOLAIR Particle Counter cannot be directly connected to an external printer. In order print to an external printer, connect the Solair to the PC with the supplied patch. Use LMS XChange or LMS Express (Free Version) to download the collected data from the SOLAIR into the PC. After data is downloaded, save it as a MS Excel file. Open MS Excel and print the saved data file.
Lighthouse particle counters count the stated particle size and the between sizes up to the next larger size while in differential mode. In Cumulative mode your instrument will count from the stated size along with all larger particles.
Knowledge Center
Stay Curious
Let’s get smarter together.
News, tips, and a friendly community are just a click away!